Oral hygiene is one of the most accessible and at the same time one of the leading methods of preventing oral diseases. Regular and competent oral care is an integral part of all preventive measures. Mass population surveys conducted in all countries of the world have convincingly shown that systematic oral care has an undoubted preventive value. It is possible to objectively assess the level of oral hygiene only using hygiene indices.
To identify dental plaque in assessing oral hygiene in modern dentistry, objective indicators (indices) are used that characterize the quality and quantity of dental plaque. However, the number of assessment methods, which are based on different numbers of teeth from different functional groups, up to staining all teeth on both sides or collecting and weighing plaque around individual teeth, indicates the relevance of the problem under consideration and the imperfection of existing methods.
Oral hygiene indices.
Method for determining the Fedorov-Volodkina hygienic index // E.M. Melnichenko “Prevention of dental diseases”, Minsk, “Higher School”., 1990, pp. 3-17.
It is determined by the intensity of the color of the vestibular surface of the six lower frontal teeth by applying an iodine-iodide-potassium solution (Schiller-Pisarev liquid).
The calculation is carried out according to the formula:
Ksr (hygiene index) = Kn (total hygiene index for each of the six teeth) / n (number of teeth).
Coloring the entire surface of the crown is scored 5 points, 3/4 of the surface - 4, 1/2 of the surface - 3, 1/4 of the surface - 2 points. If there is no staining, 1 point is given. The indicator is assessed as follows: good index, satisfactory, unsatisfactory, bad, very bad.
However, the proposed method has a number of disadvantages:
— determination of the quality and quantity of dental plaque, assessment of the hygiene index was carried out only on one’s own teeth; — the use of known dyes is impossible when determining the amount of dental plaque on bridges, since these solutions are difficult to wash off from the surface of the dentures.
| Name | Facilities diagnostics | Self-control criteria |
| 1. Fedorov-Volodkina index | Lugol's solution 1.1-1.5 is good 1.6-2.0 - satisfactory 2.1-2.5 - unsatisfactory 2.6-3.4 - bad 3.5-5.0 - very bad | The vestibular surface of the six front teeth of the lower jaw - incisors and canines - is stained with Lugol's solution. Rating on a 5-point system: 5 points – the entire surface of the teeth is stained, 4 points – 3/4 of the tooth surface, 3 points - 1/2 of the tooth surface, 2 points - 1/4 of the tooth surface, 1 point - no staining Then find the arithmetic mean by dividing the sum of the color of all teeth by their number: K av = Kp: p. Good level of hygiene: Ksr=1.0-1.3 b IG = sum of points of six teeth 6. |
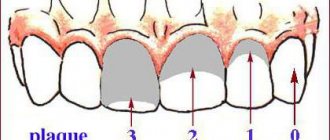
| 2. Green-Vermilion Index (1964) - universal hygiene index of the UIG | Schiller-Pisarev solution or Lugol's solution 0-0.6 good 0.7-1.6 satisfactory 1.7-2.5 unsatisfactory 2.6-3 - bad | Determine the presence of plaque and tartar on the buccal surface of the first upper molars, the lingual surface of the lower molars, and the vestibular surface 1| and lower |1 6 1| 6 6 | 1 6. On all surfaces, plaque is first determined, then tartar. 0 - no plaque (stone) 1 - plaque covers up to 1/3 of the tooth surface 2 - plaque covers from 1/3 to 2/3 of the tooth surface 3 – plaque covers more than 2/3 of the tooth surface Tartar assessment: 0 – absence of tartar 1 – supragingival tartar covers no more than 1/3 of the tooth crown 2 – supragingival tartar covers from 1/3 to 2/3 of the tooth crown, or single formations of subgingival tartar are detected 3 – supragingival tartar covers more than 2/3 of the tooth crown, or significant deposits of subgingival tartar are detected along the entire circumference of the tooth. SPI = sum of indicators of 6 teeth 6 The assessment of the tartar index is carried out similarly to UIG = IZN + IZK |
| 3. Index ONI-S | Schiller-Pisarev solution 0-no staining 1- staining up to 1/3 of the crown, 2- staining up to 2/3 of the crown 3- more than 2/3 of the tooth crown | Staining of the vestibular and lingual surfaces 6 1 | 6 6 | 1 6 The plaque index and stone index are summed up and the average is obtained. |
| RHP Index – Oral Hygiene Performance Index (Podshadley, Haley – 1968) | Color 6 teeth: 16, 26, 11, 31 – vestibular surfaces. 36, 46 – lingual surfaces | The examined surface is divided into 5 sections: 1-medial, 2-distal, 3-mid-occlusal, 4-central, 5-mid-cervical. Plaque is assessed at each site: 0 – no staining 1 – staining detected For each tooth, the site codes are summed up. Then the values of all examined teeth are summed up and the resulting sum is divided by the number of teeth. Index values: 0 - excellent 0.1-0.6 – good 0.7-1.6 – satisfactory 1.7 or more - unsatisfactory |
Definition of desensitizing action and desensitizing effectiveness
Desensitivity effect according to the Orekhova-Ulitovsky sensitivity index
In order to study the desensitivity effect of the toothpaste under study, an assessment was carried out using the Orekhova-Ulitovsky sensitivity index. The average results obtained are presented in Table 12.
Table 12:
Dynamics of desensitivity according to the Ore sensitivity index
| Orekhova-Ulitovsky sensitivity index | ||||
| Start | 1 Week | 2 week | 3 week | 4 week |
| 45,22 ± 4,18 | 39,56 ± 3,62 | 37,30 ± 4,34 | 36,21 ± 3,48 | 32,49 ± 3,15 |
From Table 12 it can be seen that under the influence of the paste used there was a decrease in the Orekhova-Ulitovsky sensitivity index.
Table 13 presents data characterizing the dynamics of desensitizing effectiveness according to the Orekhova-Ulitovsky sensitivity index.
Table 13:
Change in desensitivity efficiency according to the Orekhova-Ulitovsky index during the period of application of the paste
| Desensitivity efficiency according to the Orekhova-Ulitovsky index | |||
| 1 Week | 2 week | 3 week | 4 week |
| 12,52 ± 1,74 | 17,51 ± 1,28 | 19,92 ± 2,47 | 28,15 ± 3,21 |
Table 13 shows that the desensitizing effectiveness according to the Orekhova-Ulitovsky index under the influence of the toothpaste used increased from 12.52% to 28.15%.
Index of need for periodontal disease treatment - CPITN
To assess the prevalence and intensity of periodontal diseases, almost all countries use the index of need for the treatment of periodontal diseases - CPITN . This index was proposed by specialists of the WHO working group to assess the condition of periodontal tissues during epidemiological surveys of the population.
Currently, the scope of the index has expanded, and it is used to plan and evaluate the effectiveness of prevention programs, as well as calculate the required number of dental personnel. In addition, the CPITN index is currently used in clinical practice to examine and monitor the periodontal condition of individual patients.
In this regard, the CPITN index can be considered a screening test at both the population and individual levels.
This index registers only those clinical signs that may undergo reverse development: inflammatory changes in the gums, which are judged by bleeding, tartar. The index does not record irreversible changes (gingival recession, tooth mobility, loss of epithelial attachment), does not indicate the activity of the process and cannot be used to plan specific clinical treatment in patients with developed periodontitis.
The main advantages of the CPITN index are the simplicity and speed of its determination, information content and the ability to compare results.
To determine the CPITN index, the dentition is conventionally divided into 6 parts (sextants), including the following teeth: 17/16, 11, 26/27, 36/37, 31, 46/47.
The periodontium is examined in each sextant, and for epidemiological purposes only in the area of the so-called “index” teeth. When using the index for clinical practice, the periodontium is examined in the area of all teeth and the most severe lesion is identified.
It should be remembered that a sextant is examined if it contains two or more teeth that cannot be removed. If only one tooth remains in the sextant, it is included in the adjacent sextant, and this sextant is excluded from the examination.
In the adult population, starting from 20 years of age and older, 10 index teeth are examined, which are identified as the most informative:
When examining each pair of molars, only one code characterizing the worst condition is taken into account and recorded.
For persons under 20 years of age, 6 index teeth are examined during the epidemiological survey: 16, 11, 26, 36, 31, 46.
CODE 1: bleeding observed during or after probing.
Note: bleeding may appear immediately or after 10-30 seconds. after probing.
CODE 2: tartar or other plaque-retaining factors (overhanging edges of fillings, etc.) are visible or felt during probing.
CODE 3: pathological pocket 4 or 5 mm (the edge of the gum is in the black area of the probe or the 3.5 mm mark is hidden).
CODE 4: pathological pocket 6 mm deep or more (with the 5.5 mm mark or black area of the probe hidden in the pocket).
CODE X: When only one or no teeth are present in the sextant (third molars are excluded unless they are in place of second molars).
To determine the need for periodontal disease treatment, population groups or individual patients can be categorized based on the following criteria.
0: CODE 0 (healthy) or X (excluded) for all 6 sextants means that there is no need for treatment for this patient.
1: A CODE of 1 or higher indicates that this patient needs to improve his oral hygiene status.
2: a) CODE 2 or higher indicates the need for professional hygiene and the elimination of factors that contribute to plaque retention. In addition, the patient needs training in oral hygiene.
b) CODE 3 indicates the need for oral hygiene and curettage, which usually reduces inflammation and reduces pocket depth to values equal to or less than 3 mm.
3: Sextant with CODE 4 can sometimes be successfully treated with deep curettage and adequate oral hygiene. In other cases, this treatment does not help, and then complex treatment is required, which includes deep curettage.
The prevalence and intensity of periodontal disease in the population is assessed based on the results of a survey of 15-year-old adolescents.
Prevalence of signs of periodontal damage (adolescents 15 years old)
Prevalence Bleeding gums Tartar
low 0 – 50% 0 – 20%
average 51 – 80% 21 – 50%
high 81 – 100% 51 – 100%
Level of intensity of signs of periodontal damage (adolescents 15 years old)
INTENSITY LEVEL BLEEDING GUMS CALCULUS
LOW 0.0 - 0.5 sextants 0.0 - 1.5 sextants
AVERAGE 0.6 - 1.5 sextants 1.6 - 2.5 sextants
HIGH < 1.6 sextants < 2.6 sextants
Desensitizing effect on diagnostic samples
Table 14 presents the definition data for diagnostic samples.
Table 14:
Dynamics of changes in sensitivity based on diagnostic samples
| Sensitivity indicators (%) | |||||
| Diagnostic tests | Start | 1 Week | 2 week | 3 week | 4 week |
| VT | 71 ± 3,62 | 64 ± 4,25 | 57 ± 3,81 | 55 ± 3,92 | 49 ± 3,41 |
| LPZ | 77 ± 3,88 | 70 ± 3,53 | 63 ± 4,26 | 59 ± 4,33 | 53 ± 3,72 |
| Sun | 72 ± 4,37 | 65 ± 3,95 | 59 ± 4,81 | 55 ± 4,26 | 48 ± 3,50 |
| PVS | 76 ± 3,91 | 68 ± 4,58 | 62 ± 3,77 | 57 ± 3,10 | 53 ± 4,26 |
| BVS | 78 ± 4,25 | 70 ± 4,31 | 65 ± 3,46 | 58 ± 3,19 | 52 ± 3,68 |
From Table 14 it can be seen that the results of determining the indicators of diagnostic samples indicate a gradual decrease in the indicators of all diagnostic samples studied.
Table 15 summarizes the results of determining changes in desensitivity effectiveness (sensitivity effectiveness) during the testing period.
Table 15:
Changes in sensitivity efficiency based on diagnostic samples
| Sensitivity Performance Indicators | ||||
| Diagnostic tests | 1 Week | 2 week | 3 week | 4 week |
| VT | 9,86 ± 2,47 | 19,72 ± 2,33 | 22,54 ± 3,63 | 30,99 ± 3,45 |
| LPZ | 9,09 ± 3,15 | 18,18 ± 2,91 | 23,38 ± 3,47 | 31,17 ± 4,18 |
| Sun | 9,72 ± 3,21 | 18,06 ± 3,70 | 23,61 ± 4,62 | 33,33 ± 4,37 |
| PVS | 10,53 ± 4,27 | 18,42 ± 4,35 | 25,00 ± 3,30 | 30,26 ± 3,82 |
| BVS | 10,26 ± 4,05 | 16,67 ± 3,94 | 25,64 ± 3,47 | 33,33 ± 3,69 |
Table 15 shows that the integrative indicator of desensitivity efficiency for diagnostic samples during the testing period increased from 9.89% (1 week) to 31.82%.
Gingivitis index PMA (Schour, Massler) modified by Parma
Gingivitis index PMA (Schour, Massler) as modified by Parma (determination of risk factors) - papillary-marginal-alveolar index is calculated by adding the assessments of the gum condition of each tooth in % using the formula:
RMA = sum of indicators x 100%
3 x number of teeth
0 - no inflammation,
1 - inflammation of the interdental papilla (P)
2 - inflammation of the marginal gum (M)
3 - inflammation of the alveolar gum (A)
At the age of 6-7 years, the number of teeth is normally 24, at 12-14 years - 28, and at 15 years and older - 28 or 30.
The PMA index is very sensitive to the slightest changes in the clinical picture, and its value can be influenced by random influences.
Silness-Lohe method
In periodontics, preference is often given to the Silness-Lohe technique, which is based on determining the amount of soft plaque in the gingival zone. The essence of the method is simple: the dentist runs the end of the probe along the neck of the tooth, capturing the gingival groove. If the instrument does not capture plaque at all, a score of 0 is given. If the amount of plaque is small - 1. If a thin layer of plaque is noticeable near the neck of the tooth, and a significant amount is retained on the probe - 2. If a large amount of plaque and food is visually determined in the area where the gum adjoins the tooth. residues - Z. The indicators of all teeth are added up, the result is divided by the number of teeth.
Up to contents
The information in this article is for reference only and does not replace professional advice from a doctor. To make a diagnosis and prescribe treatment, consult a qualified specialist.
Iodine index of enamel remineralization.
The active permeability of iodine in tooth tissue is known. Remineralization index (RI), which characterizes the effectiveness of the remineralization therapy used. It is assessed using a four-point system:
1 point – no staining of the tooth area;
2 points - light yellow coloration of the tooth area;
3 points - light brown or yellow staining of the tooth area;
4 points - dark brown staining of the tooth area.
The calculation is carried out according to the formula:
IR = IRNP x number of teeth with hypersensitivity / n,
where IR is the remineralization index;
RRI—remineralization index of one non-carious lesion;
n is the number of teeth being examined.
Dark brown and light brown staining indicates demineralization of the tooth area with non-carious lesions; light yellow - indicates a certain level of remineralization processes in this area of the tooth, and the absence of staining or its slightly yellow color demonstrates a good level of the remineralization process of a particular non-carious tooth lesion.
Change in Integrative Desensitivity Efficiency
Table 3 presents the results of calculating Integrative Desensitivity Efficiency (IDE).
Table 3
Dynamics of changes in Integrative desensitivity efficiency during the entire testing period
Table 3 shows that throughout the entire study period there was an increase in digital indicators of IDE from 34.39% after 1 week to 66.27% at the end of the work.
Conclusion
Hygienic indices are individual indicators for a person. They can assess the condition of the mouth and its health. Based on the characteristics of the human body, the specialist applies one of the techniques.
All of them are easy to carry out, do not cause discomfort or pain to the examined patient, and do not require preparatory manipulations. The solutions used for staining deposits are safe.
Thanks to such an assessment, the dentist can not only find out the initial condition of the oral cavity, but also make a forecast regarding the development of the condition in the future, and monitor changes in the gum tissue and teeth after treatment.
If you find an error, please select a piece of text and press Ctrl+Enter.
Tags hygiene index care
Did you like the article? stay tuned
Previous article
Does the price of the Zoom 4 teeth whitening method correspond to its quality and effectiveness?
Next article
Desensitizers in dentistry - effective elimination of dental hypersensitivity
Classification of root furcation lesions
It is determined using a special curved Naber probe or a regular blunt probe. Furcation lesions are determined in both horizontal and vertical positions.
In the horizontal direction: I – a slight depression is visible in the mucous membrane on the buccal surface, but the probe does not enter the area of depression or penetrates the defect to a depth of 1-2 mm. II – the probe enters the bifurcation by more than 1-2 mm, but the connection between one furcation and another is not determined III – the place of the furcation is visible, with the help of the probe you can pass from one furcation to another.
In the vertical direction (Tarnow, Fletcher, 1984): 1 – vertical loss of bone from 1 to 3 mm; 2 - vertical loss of bone in the furcation area up to 4-6 mm; 3 - vertical loss of bone 7 mm. and more.
Classifications of tooth mobility
1. According to Evdokimov. 1st degree – the tooth moves in the vestibo-oral direction by no more than 1 mm. in relation to the crown of the adjacent tooth; 2nd degree – the tooth moves in the vestibulo-oral and mesiodistal direction by no more than 1 mm. in relation to the crown of the adjacent tooth; 3rd degree – mobility is added in the vertical direction;
2. According to Entin. 1st degree – displacement of the tooth in the vetibulo-oral direction; 2nd degree - the tooth moves in the vestibulo-oral and mesiodistal direction; 3rd degree - mobility is added in the vertical direction; 4th degree – mobility in three directions and tooth rotation.
3. According to the Miller-Flesar scale (1980) . 0 – the tooth is stable, there is only physiological mobility; 1 – tooth displacement along the vertical axis is no more than 1 mm. along the vertical axis by no more than 1 mm. 2 – the tooth moves by 1-2 mm. in the vestibulo-oral direction, the function is not impaired; 3 – mobility is pronounced, the tooth moves in the vestibulo-oral direction and along the vertical axis, the function is impaired.
General overview
The hygiene index is an indicator by which the condition of the oral cavity is assessed. The level of enamel purity, the ratio of carious and healthy tissues is assessed, the presence of bacteria and deposits, and their percentage expression is revealed.
Based on the data obtained, the dentist, during periodic examinations, can identify the causative factor of tooth decay and the development of gum disease, and take preventive measures to prevent many severe pathologies of the mucous membrane.
Using the index, the doctor determines:
- stage of destruction of individual teeth;
- the number of elements removed and those to be extracted;
- quality and regularity of hygiene procedures;
- stage of soft tissue damage;
- the degree of malocclusion and its type;
- the effectiveness of the treatment.
For the analysis of all types of pathologies of teeth, mucous membranes and tissues, there are generally accepted indicators.